As VU UCDS participants in the HEDGE-IoT project, we wrote a blog post detailing the OfficeGraph knowledge graph. You can ready it on the project website:


As VU UCDS participants in the HEDGE-IoT project, we wrote a blog post detailing the OfficeGraph knowledge graph. You can ready it on the project website:


The HorizonEurope project HEDGE-IoT started January 2024. The 3.5 year project will build on existing technology to develop a Holistic Approach towards Empowerment of the DiGitalization of the Energy Ecosystem through adoption of IoT solutions. For VU, this project allows us to continue with the research and development initiated in the InterConnect project on data interoperability and explainable machine learning for smart buildings.

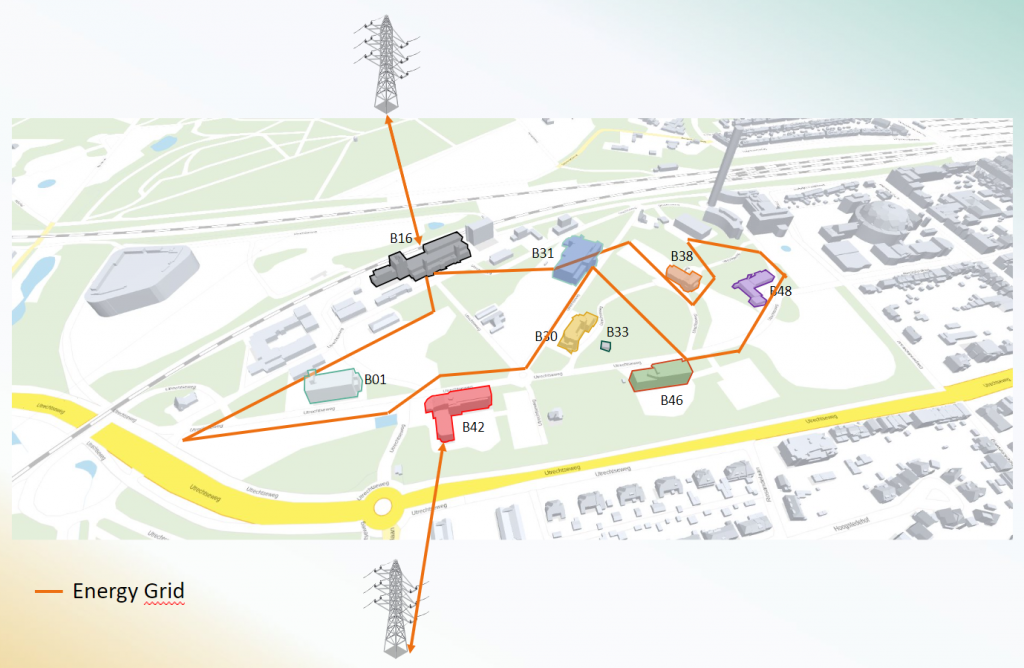
Researchers from the User-Centric Data Science group will participate in the project mostly in the context of the Dutch pilot, which will run in Arnhems Buiten, the former testing location of KEMA in the east of the Netherlands. In the pilot, we will collaborate closely with the other Dutch partners: TNO and Arnhems Buiten. At this site, an innovative business park is being realized that has its own power grid architecture, allowing for exchange of data and energy, opening the possibility for various AI-driven services for end-users. HEDGE-IoT project kickoff
VU will research a) how such data can be made interoperable and enriched with external information and knowledge and b) how such data can be made accessible to services and end-users through data dashboards that include explainable AI.

The image above shows the Arnhems Buiten buildings and the energy grid (source: Arnhems Buiten)

The InterConnect project gathers 50 European entities to develop and demonstrate advanced solutions for connecting and converging digital homes and buildings with the electricity sector. Machine Learning (ML) algorithms play a significant role in the InterConnect project. Most prominent are the services that do some kind of forecasting like predicting energy consumption for (Smart) devices and households in general. The SAREF ontology allows us to standardize input formats for common ML approaches and that explainability can be increased by selecting algorithms that inherently have these features (e.g. Decision Trees) and by using interactive web environments like Jupyter Notebooks a convenient solution for users is created where step by step the algorithmic procedures can be followed and visualized and forms an implementation example for explainable AI.
Read more, and watch our live demonstration video on the InterConnect project page.
